Introduction
PDCAAS — the Protein Digestibility-Corrected Amino Acid Score — is the metric most food regulators use to decide whether a protein counts as “complete.” It is the number behind the claims on the side of a protein tub, and it is the reason a scoop of whey and a scoop of soy isolate can both be described as high-quality protein despite tasting, digesting, and behaving differently. The PDCAAS method evaluates a food protein by comparing its amino acid profile against a human reference requirement pattern and then correcting that score for how much of the protein the body actually absorbs.
PDCAAS (Protein Digestibility-Corrected Amino Acid Score) is the FAO/WHO method for rating dietary protein quality. It is calculated by multiplying a protein’s amino acid score by its fecal digestibility coefficient and capping the result at 1.00. Whey, egg, casein, soy isolate, and milk all reach the 1.00 ceiling; potato protein isolate is commonly reported in the 0.92–1.00 range, among the highest values of any plant protein. Because the score is truncated, several proteins of genuinely different quality all read identically at 1.00.
Protein quality matters because not all grams of protein are interchangeable. A gram of collagen and a gram of egg white both register on a nutrition label, but one lacks an essential amino acid entirely and the other supplies all nine in usable proportions. For a reader who has spent years reading ingredient labels by default, PDCAAS is the single number that separates “protein content” from “protein that does the job.” This review explains how the score is calculated, what it captures, what it misses, and where potato protein isolate lands against the proteins most people already know.
The short version: potato protein isolate scores at or near the top of the PDCAAS scale, on par with several animal proteins. The longer version — the one worth understanding before you decide a number on a label means what you think it means — involves a reference pattern, a digestibility coefficient, a deliberate ceiling, and an ongoing debate about whether the whole method should be replaced. If you are new to the ingredient itself, our overview of what potato protein is and how it is made covers the source material before this article gets into the scoring.
What the Evidence Shows
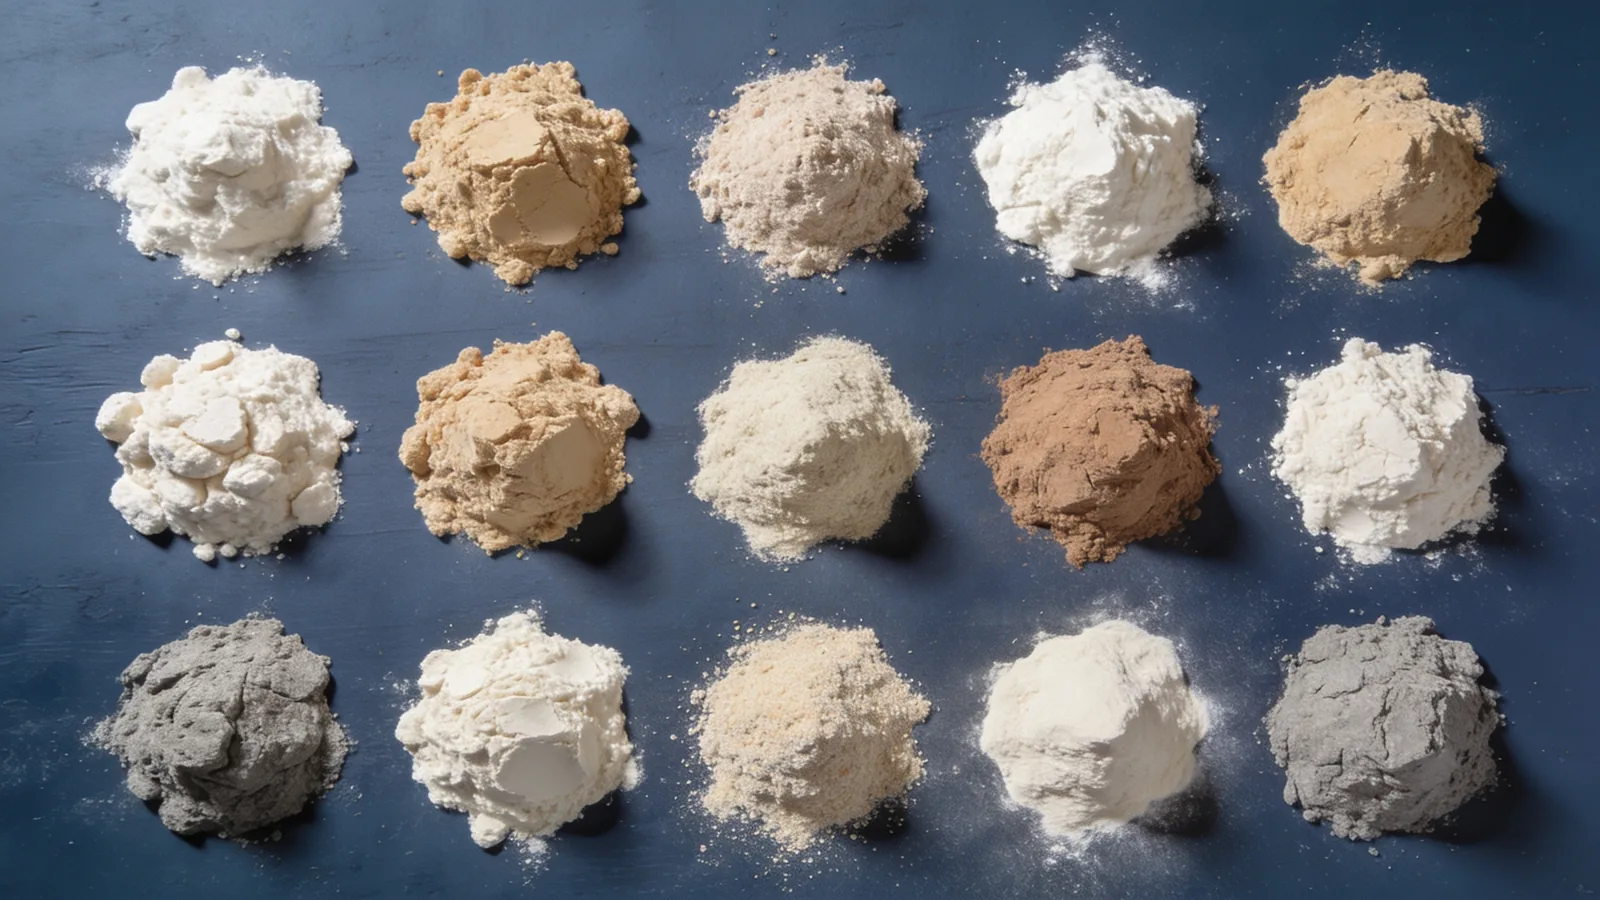
Across the published literature, a consistent hierarchy appears: animal proteins and a small group of refined plant isolates cluster at the top of the PDCAAS scale, while most unprocessed plant foods fall below it. A 2024 review of protein structure and digestibility summarized the pattern directly, noting that animal proteins are generally highly digestible and nutritionally superior to plant proteins, with higher amino acid bioavailability. Potato protein isolate is one of the exceptions that complicates that tidy story.
The proteins that reach 1.00
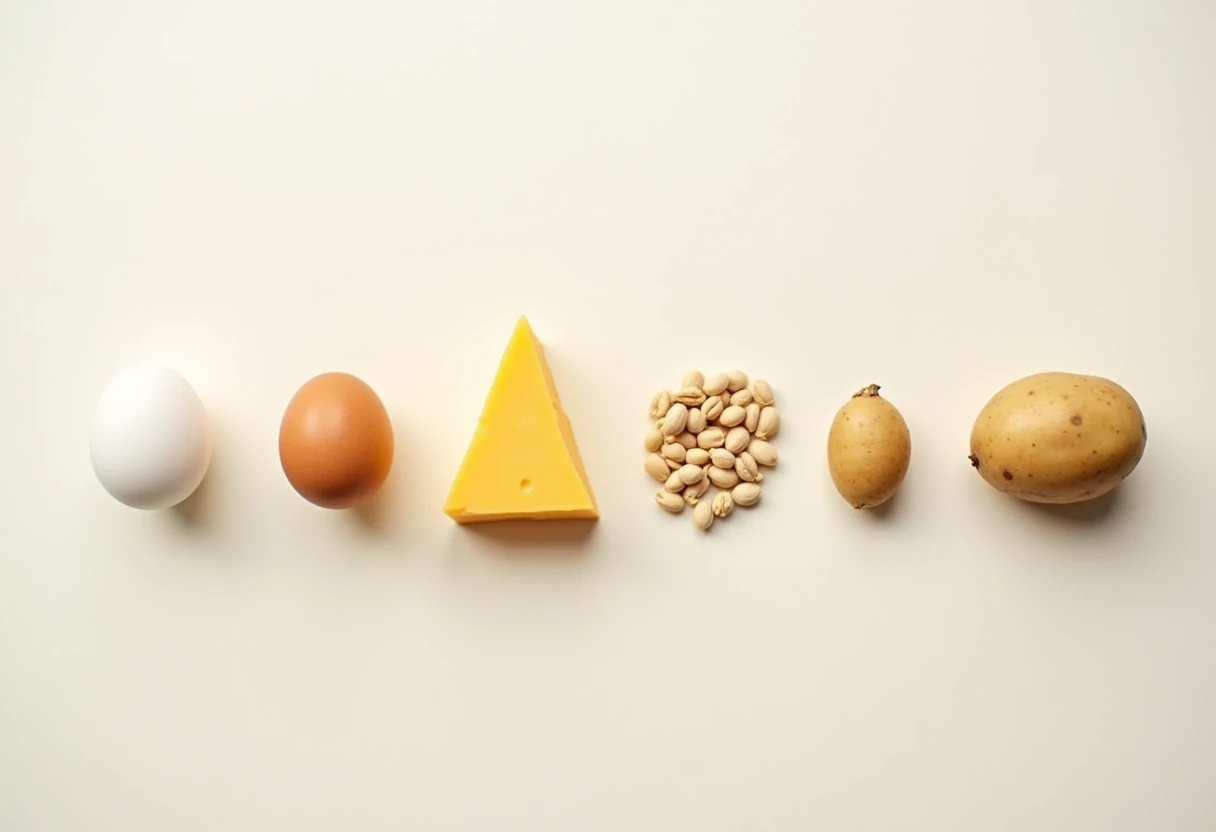
A reference analysis published in Nutrients in 2021 reported that milk, whey, egg, casein, and soy protein isolate all score 1.00 — the highest possible PDCAAS value. Egg protein’s 1.00 is the textbook benchmark; Schaafsma’s foundational 2000 paper on the method described how the chemical score is corrected for true fecal digestibility and then truncated at 100% for the highest-quality proteins. The 0.25-to-1.00 spread is the working range of the whole scale: wheat gluten near the floor, animal proteins and refined isolates at the ceiling.
Where potato protein lands
Potato protein isolate is commonly reported with a PDCAAS in the range of 0.92 to 1.00, placing it level with several animal proteins rather than with the bulk of plant foods. Two sourced findings support that placement. First, a 2020 Nutrients review found that of the plant proteins it assessed, four — canola, potato, pea, and quinoa — reached a PDCAAS of at least 0.75, with potato among the higher performers in that group. Second, Herreman and colleagues reported that potato protein is classified as an excellent-quality protein with an average DIAAS above 100%, a value that, on the DIAAS scale, corresponds to the kind of complete-protein status PDCAAS expresses as 1.00. The two metrics differ in method, but both place potato protein in the top tier.
Potato protein isolate is one of a small handful of plant proteins that perform like animal proteins on standardized quality scores — a PDCAAS reported at the upper end of the scale and a DIAAS classified as excellent at above 100%.
A comparison of common protein sources
| Protein source | PDCAAS | Limiting amino acid | Notes |
|---|---|---|---|
| Potato protein isolate | 0.92–1.00 | — | DIAAS classified as excellent (above 100%) |
| Whey | 1.00 | None (complete) | Reaches the ceiling |
| Egg | 1.00 | None (complete) | Historic reference protein |
| Casein | 1.00 | None (complete) | Reaches the ceiling |
| Milk | 1.00 | None (complete) | Reaches the ceiling |
| Soy protein isolate | 1.00 | None (complete) | Reaches the ceiling |
| Pea | ≥0.75 | Methionine + cysteine | Sulfur amino acid chemical score ~46% |
| Rice | — | Lysine (typical) | Not well established |
| Hemp | — | Lysine (typical) | Not well established |
| Wheat gluten | 0.25 | Lysine | Near the scale floor |
| Collagen | ~0 | Tryptophan | Tryptophan 0.00 g/100g; incomplete |
The table makes the central limitation of PDCAAS visible at a glance. Six entirely different proteins — potato at the top end of its range, whey, egg, casein, milk, and soy isolate — converge at or near 1.00, even though they differ in leucine content, digestion speed, and measured effect on muscle. Meanwhile collagen, a protein people genuinely consume in quantity, scores at the very bottom because it contains no tryptophan at all: a single missing essential amino acid drags the entire score toward zero regardless of how much total protein the powder contains.
Rice and hemp are routinely sold as protein powders, but reliable PDCAAS values for them are not well established; both are typically limited by lysine. If you want the full label-reading framework, our guide to choosing a protein powder walks through how to weigh quality scores against ingredients and testing.
Why It Happens (How PDCAAS Is Calculated)
PDCAAS is the product of two numbers: an amino acid score and a digestibility coefficient. The calculation is deliberately simple, which is both its strength as a regulatory tool and the root of its limitations. The PDCAAS method was developed in 1989 by a Joint FAO/WHO Expert Consultation on Protein Quality Evaluation and formalized in the 1991 report that food authorities still reference.
Step one: the amino acid score
The first step compares the food protein’s content of each indispensable (essential) amino acid against a reference pattern derived from human requirements. For every essential amino acid, you divide the amount present in the test protein by the amount called for in the reference pattern. The lowest of those ratios — the amino acid present in the shortest supply relative to need — becomes the protein’s amino acid score, and the amino acid responsible is called the limiting amino acid. This is why a single deficiency dominates the result. Collagen contains zero tryptophan, so its tryptophan ratio is zero, so its amino acid score is zero, no matter how generous it is with every other amino acid.
For plant proteins, the limiting amino acid is usually predictable. Pea protein is limited by the sulfur amino acids methionine and cysteine; across a set of new pea genotypes, that pairing averaged a chemical score of roughly 46%, the lowest of any amino acid measured. Grains like wheat are typically limited by lysine, which is what pulls wheat gluten down to about 0.25. Potato protein avoids the most common plant shortfalls, which is the structural reason it scores so much higher than its plant peers rather than alongside them.
Step two: the digestibility correction
The amino acid score describes what is theoretically present. The second step corrects for what the body can actually extract. In classic PDCAAS, the amino acid score is multiplied by the protein’s true fecal digestibility coefficient — the fraction of the protein that is absorbed rather than excreted. A protein could have an excellent amino acid profile and still score poorly if it digests badly; the digestibility coefficient is the term that penalizes that. Animal proteins generally digest more completely than plant proteins, which is one reason the animal-versus-plant hierarchy persists even when the amino acid profiles are similar.
So the formula is straightforward:
- Calculate the ratio of each essential amino acid to the reference pattern.
- Take the lowest ratio — that is the amino acid score.
- Multiply the amino acid score by the true fecal digestibility coefficient.
- If the result exceeds 1.00, truncate it to 1.00.
Step three: the truncation at 1.00
The fourth step is the one that causes the most confusion. By convention, any PDCAAS above 1.00 is capped — truncated — at exactly 1.00. The reasoning is that amino acids supplied beyond requirement are not used to build protein; they are oxidized for energy, so there is no nutritional credit for the surplus. A protein that, uncorrected, would score 1.25 is reported at 1.00, identical to one that lands precisely at 1.00. This is why so many proteins share the maximum value: the ceiling collapses everything above it into a single number.
“A PDCAAS of 1.00 is the maximum; scores above it are truncated to 1.00, which is why several high-quality proteins all register the same value.”
Truncation is defensible as a regulatory shortcut and indefensible as a tool for ranking the best proteins against each other. It tells you a protein is at least adequate in every essential amino acid and well digested. It does not tell you which of two 1.00 proteins delivers more leucine, absorbs faster, or produces a larger rise in muscle protein synthesis after a meal. That distinction matters more than the score admits, and it is the engine behind the move toward a successor metric.
Practical Implications: The DIAAS Debate
For most shoppers, the practical question is not “what is the exact PDCAAS” but “is this protein good enough to count on.” A PDCAAS at or near 1.00 answers that: the protein supplies every essential amino acid in adequate proportion and digests well. Potato protein isolate clears that bar comfortably. The complication arrives when you try to rank two ceiling proteins against each other, which is precisely what the newer scoring system was built to do.
What DIAAS changes
DIAAS — the Digestible Indispensable Amino Acid Score — was proposed by the FAO in 2013 as a successor to PDCAAS, set out in FAO Food and Nutrition Paper 92. It differs from PDCAAS in two consequential ways. First, it measures digestibility at the end of the small intestine (ileal digestibility) for each individual amino acid, rather than using a single fecal coefficient for the whole protein — a more precise reading of what is actually absorbed for protein synthesis. Second, and more visibly, DIAAS does not truncate. Values above 100% are reported as they are calculated, so a protein that genuinely exceeds requirement is allowed to show it.
The practical effect of removing the cap can be seen in how the two metrics diverge near the top. A 2024 review tracking a decade of DIAAS use concluded that DIAAS is currently the most accurate score for routinely assessing the protein quality rating of single-source proteins — a stricter, more granular measurement than the truncated PDCAAS it is intended to replace. The newer metric does not automatically flatter plant proteins; it simply measures them differently, and sometimes the difference cuts the other way.
Why the gap is small for potato protein
For potato protein isolate specifically, the choice between metrics changes little. Its PDCAAS sits at the upper end of the plant range, and its DIAAS has been classified as excellent at above 100% — both pointing to the same conclusion that this is a high-quality protein by either accounting method. The McMaster group’s controlled feeding work reinforced that placement functionally rather than theoretically: Oikawa and colleagues found that 25 g of potato protein isolate taken twice daily increased muscle protein synthesis rates in young women at rest and after resistance exercise, and concluded it was a high-quality plant-based protein source. A protein that performs that way in a human trial is not relying on a generous scoring convention to look good.
Whether scored by PDCAAS or DIAAS, potato protein isolate lands in the top tier. The metric debate matters most for borderline proteins; for potato protein the two systems agree.
Why two 1.00 proteins can still differ
The clearest illustration of what PDCAAS cannot see comes from comparisons between proteins that share the same score. Soy protein isolate and whey both score 1.00, yet they stimulate muscle protein synthesis to different degrees. Tang and colleagues demonstrated this directly: whey raised post-exercise mixed muscle protein synthesis more than soy isolate, an effect they attributed to whey’s faster digestion and higher leucine content rather than to any difference in PDCAAS. A similar pattern appears with casein — whey stimulated postprandial muscle protein accretion more effectively than casein and casein hydrolysate in older men, again despite identical PDCAAS values.
The lesson is not that PDCAAS is wrong but that it is answering a narrower question than people assume. It certifies adequacy and digestibility. It does not rank anabolic potency, and it was never designed to. For a deeper treatment of how complete and incomplete proteins are defined and combined, see our explainer on complete versus incomplete proteins. And if your interest is specifically muscle response rather than label adequacy, our comparison of potato protein versus whey covers the leucine and absorption-speed differences the score leaves out.
What a high score is worth at the shelf
For the practical buyer, PDCAAS earns its keep as a floor, not a ranking. A protein at or near 1.00 means you are not quietly short-changing yourself on an essential amino acid — the failure mode of collagen, gelatin, and most single-grain proteins. It means the digestibility correction has already been applied, so the grams on the label are largely grams you will absorb. For an allergy parent choosing a single-ingredient protein for a child who cannot have dairy, eggs, nuts, or soy, a high PDCAAS confirms that the swap does not cost protein quality. That confirmation is the point of the number.
Limitations & Open Questions
PDCAAS is a useful number wrapped in several limitations that the number itself does not advertise. Anyone citing a protein quality score should understand what it leaves out, because the gaps are where most label confusion lives.
The ceiling erases real differences
The most consequential limitation is the truncation already described. Capping at 1.00 means the score cannot distinguish among the proteins people most want to compare. Whey, egg, casein, milk, and soy isolate all read 1.00, and so does potato protein at the top of its range — yet the human-trial evidence shows these proteins do not produce identical muscle responses. DIAAS addresses this by removing the cap, but DIAAS is not yet the standard on most labels, and its more demanding ileal-digestibility measurements are available for fewer proteins. The transition from one metric to the other is incomplete.
A single number for a single meal
Both PDCAAS and DIAAS score a protein in isolation. Real diets mix proteins across a day, and complementary proteins cover each other’s limiting amino acids — the classic example being a grain limited by lysine paired with a legume limited by sulfur amino acids. A score assigned to one ingredient eaten alone can understate the quality of that ingredient as part of a varied diet. For potato protein this works in the consumer’s favor: its profile already complements the grain-heavy patterns common in plant-forward eating.
Digestibility is measured, not guaranteed
The digestibility coefficient in any published score comes from a specific test protein prepared a specific way. Commercial isolates vary. Processing, particle size, and the food matrix a protein is eaten in can all shift real-world absorption. A published 1.00 for “potato protein isolate” is a property of the tested material, not a promise about every powder that shares the name. This is one more reason the underlying ingredient and its testing matter as much as the headline score.
Open questions worth tracking
- How consistently do commercial potato protein isolates reproduce the DIAAS values reported in the research literature, given variation in processing?
- Will DIAAS displace PDCAAS on consumer labels, and over what timeframe, given that the FAO recommended the shift back in 2013?
- How much does the gap between a 1.00-scoring plant protein and a 1.00-scoring animal protein actually matter for outcomes that people care about — strength, lean mass, recovery — when total daily protein and leucine are matched?
None of these open questions undermines the core conclusion. PDCAAS remains the most widely used protein quality score, it does the job it was built for, and potato protein isolate scores at the top of it. The honest qualification is that “scores 1.00” means “adequate and well digested,” not “best protein available” — and that the difference between those two statements is exactly the territory the next generation of scoring is trying to map. One ingredient, measured by a metric that is clear about what it certifies and quiet about what it does not.
References
- FAO/WHO. Protein Quality Evaluation: Report of the Joint FAO/WHO Expert Consultation. FAO Food and Nutrition Paper 51. Rome, 1991.
- Schaafsma G. The Protein Digestibility-Corrected Amino Acid Score. Journal of Nutrition. 2000. PMID: 10867064.
- FAO. Dietary protein quality evaluation in human nutrition. Report of an FAO Expert Consultation. FAO Food and Nutrition Paper 92. Rome, 2013.
- Plant Proteins: Assessing Their Nutritional Quality and Effects on Health and Physical Function. Nutrients. 2020. PMID: 33266120.
- Herreman et al. Food Science & Nutrition. 2020. PMID: 33133540.
- Oikawa et al. Potato Protein Isolate Stimulates Muscle Protein Synthesis at Rest and with Resistance Exercise in Young Women. Nutrients. 2020. PMID: 32349353.
- Tang et al. Ingestion of whey hydrolysate, casein, or soy protein isolate: effects on mixed muscle protein synthesis at rest and after resistance exercise in young men. Journal of Applied Physiology. 2009. PMID: 19589961.
- Digestible indispensable amino acid score (DIAAS): 10 years on. Frontiers in Nutrition. 2024. PMID: 39021594.
- Protein Nutrition: Understanding Structure, Digestibility, and Bioavailability. Foods. 2024. PMID: 38890999.
- Paul C, Leser S, Oesser S. Nutrients. 2019. PMID: 31096622.
- Whey protein stimulates postprandial muscle protein accretion more effectively than do casein and casein hydrolysate in older men. The American Journal of Clinical Nutrition. 2011. PMID: 21367943.
- Fraś et al. Nutritional Value Evaluation of New Pea Genotypes (Pisum sativum L.) Based on Their Chemical, Amino Acids and Dietary Fiber Composition. Molecules. 2024. PMID: 39519674.